
Grafana is a nice tool to graph data. It produces cool graphs and is relatively easy to setup.
Grafana has been historically used together with InfluxDB as data source, since InfluxDB is a NOSQL db made for time series, and very much plug and play.
Every time I’m confronted with graphed data, one of the first questions that pop up in my mind are ‘How was that thing doing last week?’ ‘Is it today doing better or worse than 3 months ago?’. When it came the time to answer my questions using InfluxDB I was then disappointed by how long it took to load the data.
I decided anyway to give a try to Grafana and at the time of configuring it (version 4.6), I noticed that PostgreSQL was also supported as data source.
As you might be aware of, here at Portavita we are big fan of PostgreSQL and we are successfully using it since years to serve our customers and for quite a number of internal services too.
Where there is data, there is a big chance that there is PostgreSQL too. It’s like a good friend: it is always there when you need him and he never disappoints you.
I thought it might turn out handy to know if we can use PostgreSQL to store the company time series related data too, given the fact that when it comes to tools and technologies I’m on the ‘converging’ side. The less technologies used in the company, the better.
People can become experts and expertise results in better maintenance, and better usage of resources.
The aim of this page is to document some tests made while comparing InfluxDB to PostgreSQL under some data reading scenario.
This is not a comprehensive guide to setup Grafana or InfluxDB or PostgreSQL, instead it is only a comparison on what performs better in our use case.
Before starting, I have to admit that while I have quite some experience in using and tuning PostgreSQL under high traffic situations, at the beginning of my tests I had no experience on InfluxDB.
Still at the time of writing this article, I’m not an InfluxDB guru since I think a database is a complex thing to understand and while people spend years building it, other people cannot pretend to be an expert after a few days using it.
But I definitely know more, yes.
One thing I have to acknowledge is that PostgreSQL documentation is to me easier to read and at a better state of the art compared to InfluxDB one.
What I learned during my journey is that InfluxDB is heavily optimized to host timeseries. It uses a WAL archive like PostgreSQL, so probably it will not suffer many problems when writes are heavy, it uses compression to use less space (as I will notice during my tests), it uses deltas to derive one timestamp to another, compaction to optimize reads over write…
You can learn more here: Influx Docs
A small digression
About WAL, InfluxDB docs are in my opinion a bit obscure and quite much arguable.
They say:
‘When running InfluxDB in a production environment the wal directory and the data directory should be on separate storage devices. This optimization significantly reduces disk contention when the system is under heavy write load. This is an important consideration if the write load is highly variable. If the write load does not vary by more than 15% the optimization is probably unneeded.’ Source: InfluxDB Hardware sizing guide
And here some questions raised on my mind…
-
Why only on prod envs? on dev people can have bad performances so it never reaches prod? Or if it reaches prod, then people will be happy because it performs better?
-
An hardware cookbook should be a source of truth. If you want to get the best out of it, then follow the cookbook. What if I do not use a separate disk for WAL and then my load increases?
Shall I proceed with a new (production!) installation?
- Where the good old best practice of ‘keep all your environments as equal as possible’ is gone?
This new tech wave sacrificed it in the name of the ‘Happy Flow’, I guess. New motto is ‘production, surprise me!’
.. Back to the main track
All the optimizations mentioned, usually come at a price. For example, deleting data from InfluxDB is expensive, as reported by the docs:
“Deleting data from a columnar database is expensive. InfluxDB organizes data on disk into immutable runs of values for a single column of a series. A delete operation needs to undo a lot of that work for a subset of points.
In InfluxDB, deleting a row from the database produces a tombstone. A tombstone includes a series key and the min and max time of the deleted range. This allows a very compact expression for the primary delete use case: delete all data for an invalid series between times t1 and t2.
When sufficient tombstones collect, TSM data is re-compacted into a new immutable file with the deleted data removed and tombstone records deleted. At query time, tombstones are checked to avoid processing data marked as deleted”
Updates are not provided:
“InfluxDB does not support an UPDATE statement. However, re-inserting a fully qualified series key at an existing timestamp will replace the old point’s field value with the new field value”
Source: https://www.influxdata.com/blog/influxdb-internals-101-part-two/
..and is still unclear to me if compaction can be triggered manually or if the db is always choosing for you what to do. Every page I searched about ‘compaction’ either brought me to the docs that explain how it works but not how to trigger it, or to forums with people desperate because compaction created disasters on their db.
Another cool thing about InfluxDB is that data can Auto Expire
Same can be achieved on PostgreSQL using a multitude of ways, my favorite is when used in combo with the super powerful table-partitioning as also explained in a technically great, yet still easy to understand way at PG Day Amsterdam2018 by Boriss Mejias.
The following tests are simulating some data we are really graphing here at Portavita, concerning PostgreSQL replication. Those data represent the lag between Master and Standby dbs and are represented by 3 values: receive_lag_kb, replay_lag_kb and seconds_since_last_commit.
Software Installation and Configuration
I installed InfluxDB and PostgreSQL using the provided RPMs. Nothing fancy.
This is how the data structure on PostgreSQL was created:
 CREATE DATABASE grafana_data;
 \c grafana_data
 CREATE SCHEMA my_data;
 CREATE TABLE my_data.replication_data(time integer NOT NULL, receive_lag_kb integer NOT NULL, replay_lag_kb integer NOT NULL, seconds_since_last_commit integer NOT NULL);
 CREATE INDEX replication_data_btree ON my_data.replication_data (time);
We are expecting the timestamp to be in the form of an integer number, namely in Unix seconds.
One thing to note, is that I did not assign to ‘time’ the constraint of Primary Key. More details will come later…
grafana_data=# \d my_data.replication_data
        Table "my_data.replication_data"
          Column           |  Type   | Modifiers
---------------------------+---------+-----------
 time                      | integer | not null
 receive_lag_kb            | integer | not null
 replay_lag_kb             | integer | not null
 seconds_since_last_commit | integer | not null
Indexes:
    "replication_data_btree" btree ("time")
Following the best practice I created 2 users one for reading purposes (grafana_reader) and one with also write permissions (grafana_writer).
InfluxDB configuration was more straight forward, since there is no data structure to define. A simple:
create database grafana_data
will suffice.
After that, I configured Grafana with 2 dashboards, nothing fancy about it.
InfluxDB notes for dummies
On InfluxDB, data is structured this way:
- time value - other values
Being a NoSQL db, there are no tables. Fields are separated by commas.
To insert values:
use grafana_data
INSERT replication_data_loadtest receive_lag_kb=123,replay_lag_kb=456,seconds_since_last_commit=789
Our record shows as:
select * from replication_data_loadtest ;

time                receive_lag_kb replay_lag_kb seconds_since_last_commit
----                -------------- ------------- -------------------------
1518521687324742337 123            456           789
Note: on InfluxDB the time is represented in nanoseconds, Unix epoch. (and not seconds!)
The TestBed
Machine: Virtual Machine CentOS 6.8 is equipped with:
- SSD, and not a dedicated WAL partition.
- 12 Cores
- 9 GB RAM
The testbed aims to simulate a real life case where metrics are collected every 10 seconds, and stored for 1.5 years. That accounts for almost 5 Million records!
PostgreSQL runs on Vanilla version 9.6.6 (Latest is 10)
This is the configuration I used, even if for most of the tests (read: the cold cache tests), it will not make much difference from the default one. Only the setting about SSD disk is relevant and I think important to have:
listen_addresses = '*'

log_timezone = 'Europe/Amsterdam'
datestyle = 'iso, dmy'
timezone = 'Europe/Amsterdam'
lc_messages = 'en_US.utf8'
lc_monetary = 'nl_NL.utf8'
lc_numeric = 'nl_NL.utf8'
lc_time = 'nl_NL.utf8'
default_text_search_config = 'pg_catalog.dutch'

checkpoint_completion_target = 0.9
max_connections = 10

maintenance_work_mem = 200MB
work_mem = 128MB

max_wal_size =  1536MB

shared_buffers = 2304MB

logging_collector=on
log_line_prefix='%m %u %d %h %a PID=%p %i %l %x '
log_rotation_size= 30720 # 30720 is 30 MB
log_filename='postgresql.log'
log_rotation_age=7d
log_file_mode = 0640

log_line_prefix='%m %u %d %h %a PID=%p %i %l %x '
random_page_cost = 1   # Because we use SSD disks

log_checkpoints = on
log_lock_waits = on
log_min_duration_statement = 0
Installed InfluxDB version is 1.6 (latest)
I therefore pushed 5 million records to each database, generating random data:
These are the sections of the script who pushes data to the respective dbs.
PostgreSQL:
INSERT INTO my_data.replication_data VALUES($time_now, $receive_lag, $replay_lag, $seconds_since_last_commit) ;"
InfluxDB:
influx -database grafana_data -execute "INSERT replication_data_loadtest,host=mytesthost receive_lag_kb=$receive_lag,replay_lag_kb=$replay_lag,seconds_since_last_commit=$seconds_since_last_commit"
The Results
Disk Usage
PostgreSQL Disk Usage by the table:
grafana_data=# \dt+ my_data.replication_data
                          List of relations
 Schema  |       Name       | Type  |  Owner   |  Size  | Description
---------+------------------+-------+----------+--------+-------------
 my_data | replication_data | table | postgres | 211 MB |
And its index:
grafana_data=# \di+ my_data.replication_data_btree
                                       List of relations
 Schema  |          Name          | Type  |  Owner   |      Table       |  Size  | Description
---------+------------------------+-------+----------+------------------+--------+-------------
 my_data | replication_data_btree | index | postgres | replication_data | 107 MB |
so a total of 318 MB
InfluxDB Disk Usage:
ls /var/lib/influxdb/data/grafana_data/autogen/2/ -lh
total 87M
-rw-r--r-- 1 influxdb influxdb  87M Feb 15 17:33 000000012-000000004.tsm
Conclusions on Disk Usage
InfluxDB uses 1/4 of the space when compared to PostgreSQL
Note: PostgreSQL is using 8KB blocks by default. Further tuning might be possible according to our data, but we are not focusing on such customization right now, which would require per-case tests to determine a proper size.
Note2: more tests on disk usage below
Query time
We are going to perform 2 different kind of tests. One with a warm cache and one with a cold cache.
Warm cache means that the data we query is already present in RAM, therefore is not needed a fetch from disk.
Cold cache is when the data needs to be read from disk.
A few considerations… since Grafana usually shows most recent data, is reasonable to think that the data we are querying/showing will be present in RAM already.
That is true because a very common practice I noticed is to use the ‘auto refresh’ option that Grafana dashboard offers.
That goes together with a monitor screen always open on recent data, like today’s, or last hour’s.
But is also a good idea to check what is the behaviour when we want to fetch all our data (as in ‘Let’s compare today’s data with last month..’), or maybe data in one interval (here indexes play a big role).
Cold Cache Queries
In order to query at cold we are doing:
- Stop the ‘other’ database
- Stop the candidate DB
- Drop all caches
- Start the candidate DB
Query 5 Million Records (the whole)
PostgreSQL:
This is what I run to clear the cache and run the query:
sync ; /etc/init.d/influxdb stop ; /etc/init.d/postgresql-9.6 stop ; echo 3 > /proc/sys/vm/drop_caches ; /etc/init.d/postgresql-9.6 start ; su - postgres -c 'psql -h localhost grafana_data -c "select * from my_data.replication_data ;"'
Basically I’m asking the OS to forget everything about the disk portions it cached, and to do the same to PostgreSQL.
Also note that a sequential scan will be performed, since we are retrieving the whole table. This is the confirmation from the query plan:
                                                          QUERY PLAN
------------------------------------------------------------------------------------------------------------------------------
 Seq Scan on replication_data  (cost=0.00..77028.00 rows=5000000 width=16) (actual time=0.413..1097.563 rows=5000000 loops=1)
Results over 3 different runs:
2018-07-25 16:33:49.762 CEST postgres grafana_data 127.0.0.1 psql PID=15125 SELECT 1 0 LOG:  duration: 3700.288 ms  statement: select * from my_data.replication_data ;
2018-07-25 16:35:06.717 CEST postgres grafana_data 127.0.0.1 psql PID=15292 SELECT 1 0 LOG:  duration: 3671.934 ms  statement: select * from my_data.replication_data ;
2018-07-25 16:35:26.115 CEST postgres grafana_data 127.0.0.1 psql PID=15493 SELECT 1 0 LOG:  duration: 3712.107 ms  statement: select * from my_data.replication_data ;
So in average we pay 3694 ms to query 5 million rows.
InfluxDB:
To time the query in InfluxDB:
sync ; /etc/init.d/postgresql-9.6 stop ; /etc/init.d/influxdb stop ; echo 3 > /proc/sys/vm/drop_caches ; /etc/init.d/influxdb start ; sleep 5 ; influx -database grafana_data -execute 'select * from replication_data_loadtest' > /dev/null
(timing is last field, expressed in microseconds)
[httpd] 127.0.0.1 - - [25/Jul/2018:16:40:05 +0200] "POST /query?chunked=true&db=grafana_data&epoch=ns&q=select+%2A+from++replication_data_loadtest HTTP/1.1" 200 49154634 "-" "InfluxDBShell/1.6.0" 9f3847ac-9018-11e8-8002-000000000000 26155282

[httpd] 127.0.0.1 - - [25/Jul/2018:16:41:02 +0200] "POST /query?chunked=true&db=grafana_data&epoch=ns&q=select+%2A+from++replication_data_loadtest HTTP/1.1" 200 49154634 "-" "InfluxDBShell/1.6.0" c122413b-9018-11e8-8002-000000000000 26659135

[httpd] 127.0.0.1 - - [25/Jul/2018:16:41:45 +0200] "POST /query?chunked=true&db=grafana_data&epoch=ns&q=select+%2A+from++replication_data_loadtest HTTP/1.1" 200 49154634 "-" "InfluxDBShell/1.6.0" da57eb62-9018-11e8-8002-000000000000 25990723
An average of 26268380 microseconds, which are 26.2 seconds. To return 5 Million records.
Query a portion of data
I then performed queries on 1/10 of the data, which accounts for 500K records.
On PostgreSQL…
We can then notice from the Query Plan, that PostgreSQL makes use of an index, as expected:
 Aggregate  (cost=12953.25..12953.26 rows=1 width=8) (actual time=225.326..225.326 rows=1 loops=1)
   ->  Index Only Scan using replication_data_btree on replication_data  (cost=0.43..11670.49 rows=513103 width=0) (actual time=0.379..128.560 rows=499642 loops=1)
         Index Cond: (("time" > 500358) AND ("time" < 1000001))
         Heap Fetches: 0
Average duration is now 512 ms
Same test on one single record, and we get an average of 27ms
On InfluxDB:
Same test on InfluxDB shows an average of 2604 ms for 500K records retrieved and 26.5 ms when only one record is queried.
Warm Cache Queries
About warm cache, tests can or cannot be reproducing real life situations.
It depends much on the amount of RAM on the system and how it is used.
We suppose now that we have enough RAM to fit all the data in memory. That is not certainly the case for big installations where multiple timeseries are hosted.
That’s why I find more interesting the data on cold cache. But for the sake of completeness, I’m including also warm cache results.
In order to get results, I’m running the tests over multiple times, discarding the first run, which is the one that actually gathers data from disk.
During tests, I’m also verifying using ‘vmstat’ that there is no disk activity.
PostgreSQL Warm Cache Results:
To read the whole content of the db, it takes 3.2 second
For 500K records: 376 ms
And for one single record 0.3 ms
InfluxDB Warm Cache Results:
To query all the records takes an average of 26.4 seconds. This is the same amount of time it took to query with cold cache. Doh! (I suspect compaction will play a role here..)
Query 500K records: 2.5 seconds
For just 1 record: 11ms
Some tuning and further testing
First consideration is that BTREE indexes are not optimal for time series, space wise. A BTREE index has a Binary Tree which while being very efficient in speed, it uses a lot of space
BRIN index, Block Range Index, is using way less space, at the price of performances.
How does it work? BRIN is a clever guy.
The index is recording the first and the last value of each block (configurable in size), therefore is very tailored for cases when data is sorted, like the field ‘time’ in a time serie.
Let’s try it out:
DROP INDEX my_data.replication_data_btree;

CREATE INDEX replication_data_brin ON my_data.replication_data USING brin (time) ;
This is the difference in size:
grafana_data=# \di+ my_data.replication_data_*
                                       List of relations
 Schema  |          Name          | Type  |  Owner   |      Table       |  Size  | Description
---------+------------------------+-------+----------+------------------+--------+-------------
 my_data | replication_data_brin  | index | postgres | replication_data | 48 kB  |
 my_data | replication_data_btree | index | postgres | replication_data | 107 MB |
Oh! That’s 2282 times smaller! Oh! Oh!
Earlier on this page when talking about the Data Structure on PostgreSQL, I mentioned that we do not create a primary key on ‘time’ column.
The reason is that on PostgreSQL, wherever there is a primary key, there is a btree index. We want to be able to choose which index we want there.
But then the question:
What happens to grafana if 2 records are provided for the same time? With a PKEY on ‘time’ that will never happen. But now, by accident, we might have 2 values for the same time..
Will it explode? Wipe out the datacenter? Will it generate a diversion in the Space Time Continuum?

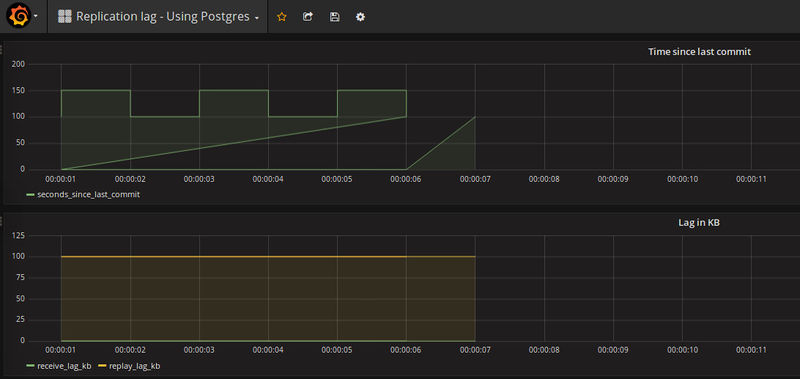
Possible scenarios that could happen when grafana sees 2 values on the same timestamp
Fortunately none of the above.. Grafana will show both values as 2 lines for the same value. On mouse over, only one value is returned.
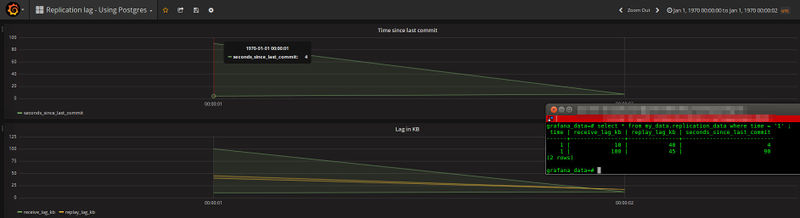
If we instead insert 3 records, 3 records are shown. Funny enough, multiple records over time give you the ability to make drawings with grafana.
Multiple points gets graphed based on the order you push them to the db.
This is me trying to create a castle-like shape:
Now let’s see how BRIN performs in our case.
Retrieve 500K records with a cold cache:
 Aggregate  (cost=41269.61..41269.62 rows=1 width=8) (actual time=264.879..264.880 rows=1 loops=1)
   ->  Bitmap Heap Scan on replication_data  (cost=5262.31..39986.85 rows=513103 width=0) (actual time=1.710..166.776 rows=499642 loops=1)
         Recheck Cond: (("time" > 500358) AND ("time" < 1000001))
         Rows Removed by Index Recheck: 21318
         Heap Blocks: lossy=2816
         ->  Bitmap Index Scan on replication_data_brin  (cost=0.00..5134.03 rows=513103 width=0) (actual time=0.752..0.752 rows=28160 loops=1)
               Index Cond: (("time" > 500358) AND ("time" < 1000001))
Average time is dropped to 1688 ms
With a warm cache instead, it takes 378 ms
Same tests on one single record show:
Cold Cache: 74ms
Warm Cache: 9ms
Conclusions
I find the topic very interesting. On the other end is very complex job to compare the 2 products because a deep understanding of InfluxDB is required.
Many people like the plug-and-play way of work of InfluxDB which I bet is a great thing until things go well. But when things go wrong, usually there is nobody in house to call for help.
This is a summary of the tests:
| Test Type | InfluxDB | PostgreSQL + BTREE | PostgreSQL + BRIN |
|---|---|---|---|
| Disk Usage | 87 MB | 318 MB | 211MB |
| Query the whole COLD CACHE | 26.2 sec | 3.7 sec | 3.7 sec |
| Query 1/10 of data COLD CACHE | 2604 ms | 512 ms | 1688 ms |
| Query one record COLD CACHE | 26.5 ms | 27 ms | 74 ms |
| Query the whole WARM CACHE | 26.4 sec | 3.2 sec | 3.2 sec |
| Query 1/10 of data WARM CACHE | 2.5 sec | 376 ms | 378 ms |
| Query one record WARM CACHE | 11ms | 0.3 ms | 9 ms |
I remind you that the tests ran on an SSD equipped machine (and no RAID). InfluxDB itself suggests to run on SSD, and given the numbers here above I can have a clue on the reasons.
On HDD things slow down, and probably InfluxDB will suffer more from that, since it looks like that it does not make an use of the cache as good as PostgreSQL does.
Also the cardinality of timeseries collected probably plays a big role here, therefore would be interesting to see how things go in those cases. Not to mention the famous and a bit still obscure to me compaction of data.
Now some InfluxDB fanatics might say: you can cluster InfluxDB! It can scale!
Nope. That’s a common misconception… You can scale only if you use a commercial version which is closed source. To me the open and the closed versions are 2 different kind of animals.
Not-a-big-fan-of-closed-source. Period.
On the other hand, PostgreSQL table partitioning in our specific case would come at huge help, and old data might be archived or streamed on a secondary PostgreSQL DWH machine.
But time is tyrant, and my backlog is full of things to do, therefore I should stop here.. for now :)
My verdict is that under the tested use cases, if disk space is really a constraint, then InfluxDB will be the way to go here at Portavita, at expenses of queries on old data. And of the coffee machine I usually find comfort in, when I’m waiting for such kind of outputs.
If disk space is not a concern, then I would definitely go for PostgreSQL.
Ideas or comments? You can find me on Linkedin