2019-07-22 update: add specs about CPU (number of cores)
Intro
As mentioned in a recent post, I’m periodically reviewing all the settings of my beloved databases and today I would like to talk to you about a setting called ‘effective_io_concurrency’.
effective_io_concurrency instructs PostgreSQL on how our disks are fast (or slow).
It has a default value of 1, and the manual defines it this way:
“Sets the number of concurrent disk I/O operations that PostgreSQL expects can be executed simultaneously. Raising this value will increase the number of I/O operations that any individual PostgreSQL session attempts to initiate in parallel. The allowed range is 1 to 1000, or zero to disable issuance of asynchronous I/O requests. Currently, this setting only affects bitmap heap scans. For magnetic drives, a good starting point for this setting is the number of separate drives comprising a RAID 0 stripe or RAID 1 mirror being used for the database. (For RAID 5 the parity drive should not be counted.) However, if the database is often busy with multiple queries issued in concurrent sessions, lower values may be sufficient to keep the disk array busy. A value higher than needed to keep the disks busy will only result in extra CPU overhead. SSDs and other memory-based storage can often process many concurrent requests, so the best value might be in the hundreds. [..]”
The setup
PostgreSQL 9.6 on a Linux host. Hardware served by 32 cores
In order to test on a bitmap heap scan, I created an ad-hoc table:
CREATE TABLE test (major int PRIMARY KEY, minor int);
.. together with a multicolumn index:
CREATE INDEX minor_idx ON test (major, minor);
And then I populated it:
INSERT INTO test VALUES ( generate_series(0,100000000), random()*1000 );
I chose the following query:
SELECT * FROM test WHERE major BETWEEN 10 AND 100 OR minor BETWEEN 800 AND 900;'
and the query plan confirms that a bitmap heap scan is there:
 Bitmap Heap Scan on test (cost=1279391.23..2027903.67 rows=10398562 width=12)
   Recheck Cond: (((major >= 10) AND (major <= 100)) OR ((minor >= 800) AND (min
or <= 900)))
   ->  BitmapOr  (cost=1279391.23..1279391.23 rows=10398572 width=0)
         ->  Bitmap Index Scan on minor_idx  (cost=0.00..2.50 rows=93 width=0)
               Index Cond: ((major >= 10) AND (major <= 100))
         ->  Bitmap Index Scan on minor_idx  (cost=0.00..1274189.45 rows=103984
79 width=0)
               Index Cond: ((minor >= 800) AND (minor <= 900))
The test runs against a machine equipped with SSDs and configured in RAID 10, but I obtained similar results on a machine with only one SSD (VM with 6 cores).
The test
Since we are testing disk performances, I’m first dropping the cache, then restart PostgreSQL and after that running the query.
for i in {1..10} ; do echo 3 > /proc/sys/vm/drop_caches ; /etc/init.d/postgresql restart ; sleep 5 ; psql -c 'EXPLAIN ANALYZE SELECT * FROM test WHERE major BETWEEN 10 AND 100 OR minor BETWEEN 800 AND 900;' ; done
Every set of tests runs against different values of effective_io_concurrency
Results
| effective_io_concurrency | Average runtime in ms |
|---|---|
| 1 | 65604 |
| 20 | 17807 |
| 100 | 16776 |
| 1000 | 16713 |
Increasing the setting, makes the query 4 times faster!
Here you can see how the disk is impacted on a comparison test run:
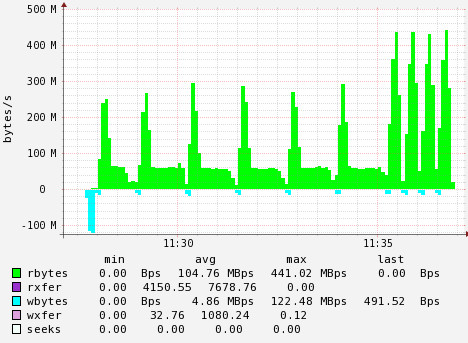
First 6 peaks: effective_io_concurrency = 1
Last 4 peaks: effective_io_concurrency = 100
Also, the number of IOPS is impacted, resulting in less IOPS:
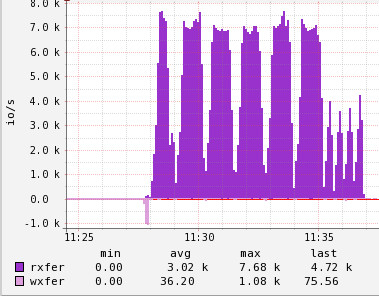
The graphs for values of 20 and 1000 are similar to the one above, as are the results.
Conclusions
It is well worth tuning effective_io_cache on your database.
And once again, it is proven that the time spent in exploring, experimenting and tuning is time well spent!
Ideas or comments? You can find me on Linkedin